JPA query methods: influence on performance
Research purposes
Specification JPA 2.2/Jakarta JPA 3.0 provides for several methods to select data from database. In this article we research how these methods affect on performance.
Methods for comparison
We will compare: Native SQL (using JPA Entity Manager), JPQL, Named JPQL, Criteria and JPQL with Entity Graph. As implementation of JPA we will use Hibernate 5.6.1.Final. For today this ORM is widely used by software developers.
As etalon, we will use native SQL with JDBC.
Tests description
For our tests we create simple database with 3 entities and fill it with randomly generated data common quantity ca 1 million rows. We choose MySQL 8 as one of most popular database. This version doesn’t use query cache, and we don’t define any indexes except necessary (primary and foreign keys).
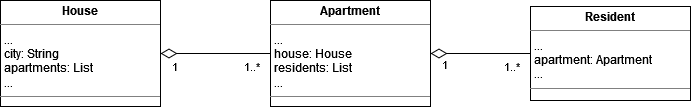
Diagram 1 — Entities
All benchmarks generate the same SQL:
SELECT
    r.*
FROM Resident r
    JOIN Apartment a ON r.apartment_id = a.id
    JOIN House h ON a.house_id = h.id
WHERE
    h.city IN (?,?,?)
This query does not reflect all possibilities of querying to database, but it is quite enough for our purposes.
To measure benchmarks we use specialized tool Java Microbenchmark Harness. As a metric we use ops/s (operations per second), 5 iterations for warm up and 9 iterations for measurement.
Before starting, it remains to solve two problems.
Problem 1
Hibernate processes each method in 3 steps (see diagram 2): translate method-specific presentation into SQL (step 1), execute this SQL (step 2) and parse result of execution (step 3).
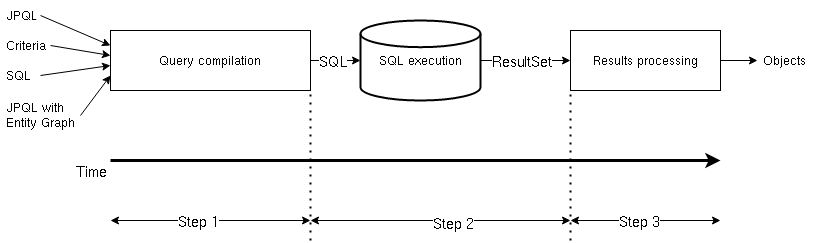
Diagram 2 — Database query processing
It is especially interesting for us duration of steps 1 and 2. We can choose parameters for query in such a way that we can be sure that result of execution is empty. Therefore, we can neglect about duration of step 3.
To separate step 1 from step 2 we prepare modification of Hibernate ORM (5.6.1.Test) that fully corresponds to 5.6.1.Final except that our modified version does not make actually selecting data from database.
Problem 2
Other difficulty for our tests is Hibernate Query Plan Cache. This cache is created on EntityManagerFactory startup and exert an influence on compilation of reused queries. Since we want to evaluate duration without this kind of cache, we must turn it off. This objective is achieved by Hibernate-specific workaround. By the way, our research contains methods with turned plan cache on too.
Tests source code is located on github.
Results and analysis
Results overview
Results are presented in table 1
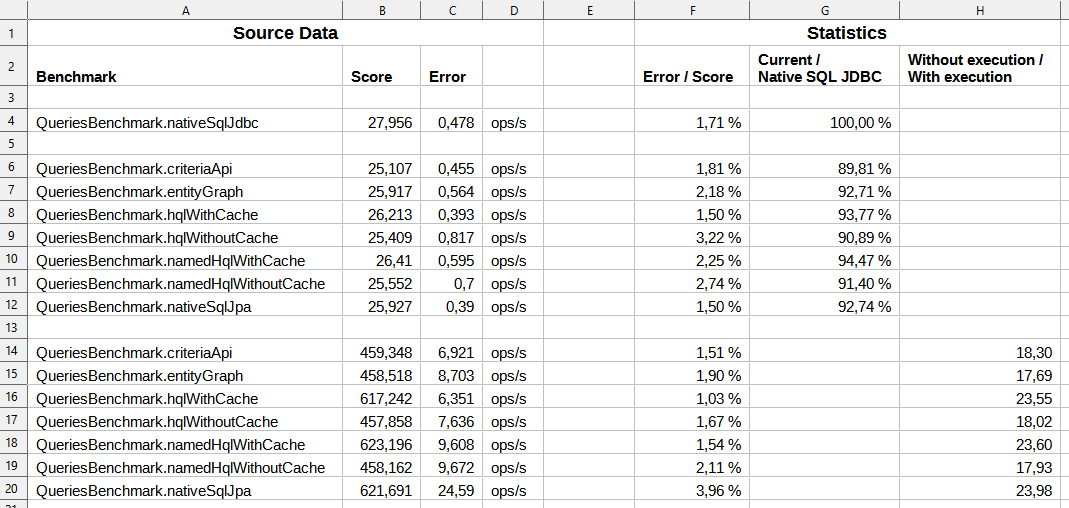
Table 1 — Benchmarks results and statistics
Column A contains list of all benchmarks. nativeSqlJdbc as is clear from the name is native SQL executed with JDBC-driver. The group of benchmarks in rows 6-12 are benchmarks executed with Hibernate JPA 5.6.1.Final. The group of benchmarks in rows 14-20 — executed with Hibernate JPA 5.6.1.Test.
Column B contains result of corresponding benchmark, C — standard error value. Columns D contains units — operations per second.
The most interesting part is in columns F-H. This is statistics. Let’s take a closer look at it.
Measurement error
Table 2 shows us ratio error/score. As we can see (column F), this ratio fluctuates in the 1-4% range. This is good indicator and it says that we can use obtained data for further research.
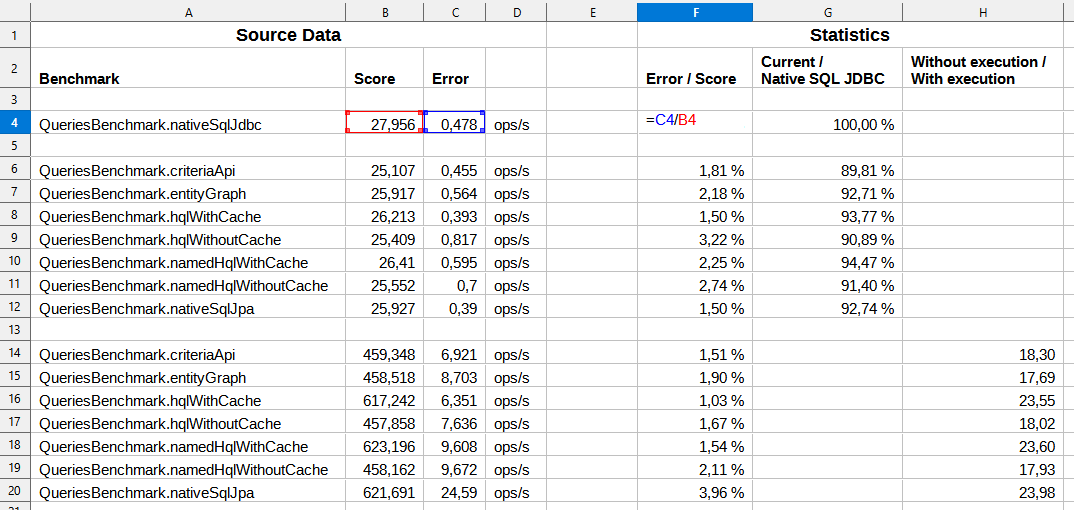
Table 2 — Error/score ratio
Comparison with native SQL
It is obvious that the highest speed have native queries executed with JDBC. Therefore, we will compare all other methods with it. As we can see from table 3 all JPA methods are slower by 7-10%.
So, the main advantages of JPA methods over JDBC — platform independence, ease of design, human readability and so on — cost us 7-10% of total query execution runtime. But these advantages are distributed between JPA method unevenly. JPQL is more readable, Criteria API is typesafe, with Entity Graph we can dynamically manage lazy/eager-loading between entities. What influence each of these characteristics has on query performance we can see in column G.
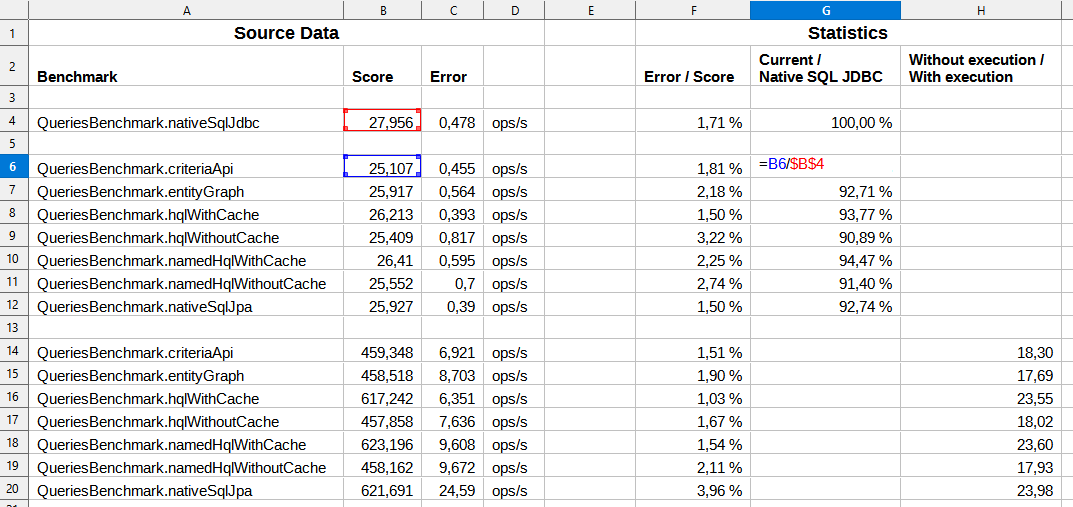
Table 3 — Comparison with native SQL JDBC
With and without SQL execution
How much time is spent on preparing SQL (query “compilation”) compared to its execution? Of course, many factors have an influence on this ratio. Therefore, use the following data only as indicative. As we can see from table 4 (column H) SQL preparation occurs 18-24 times faster than preparation with execution! This result of our research is very important. Comprehend it in more details.
If we detected a query with low performance the change of source query (JPQL, Criteria, Entity Graph) will have an impact at the level 4-6%. In other words, changing JPA query method to increase performance is not a good idea. More useful will be change prepared (“compiled”) SQL or apply database-specific optimizations. Database indexes, for example.
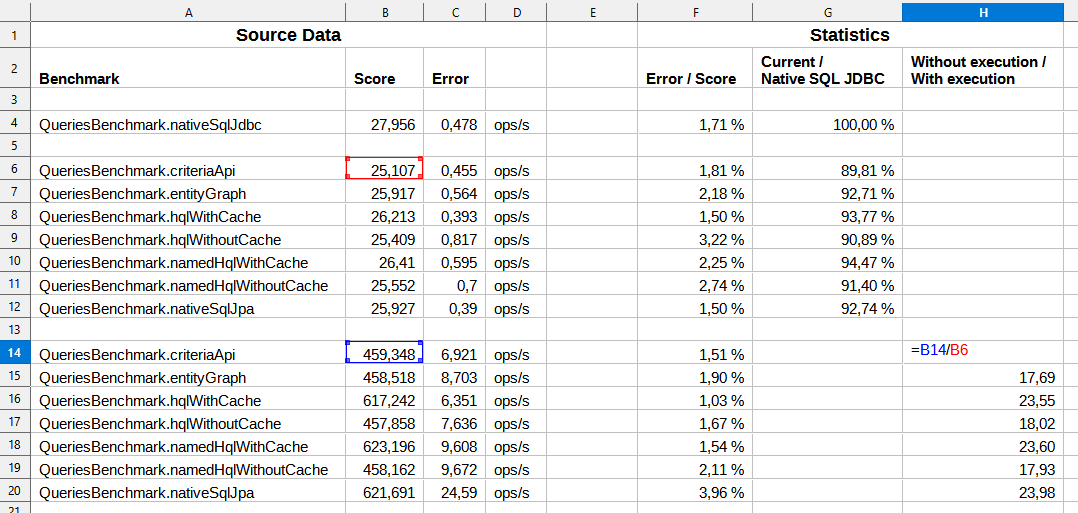
Table 4 — With and without execution
With and without Hibernate Query Plan Cache
Additional research is devoted to impact of Hibernate Query Plan Cache on query compilation and execution. Table 5 (column I) shows us this impact. If for cases with execution this impact almost unnoticeable, then for preparation situation differs. Query Plan Cache increases speed of query compilation by ~35%.
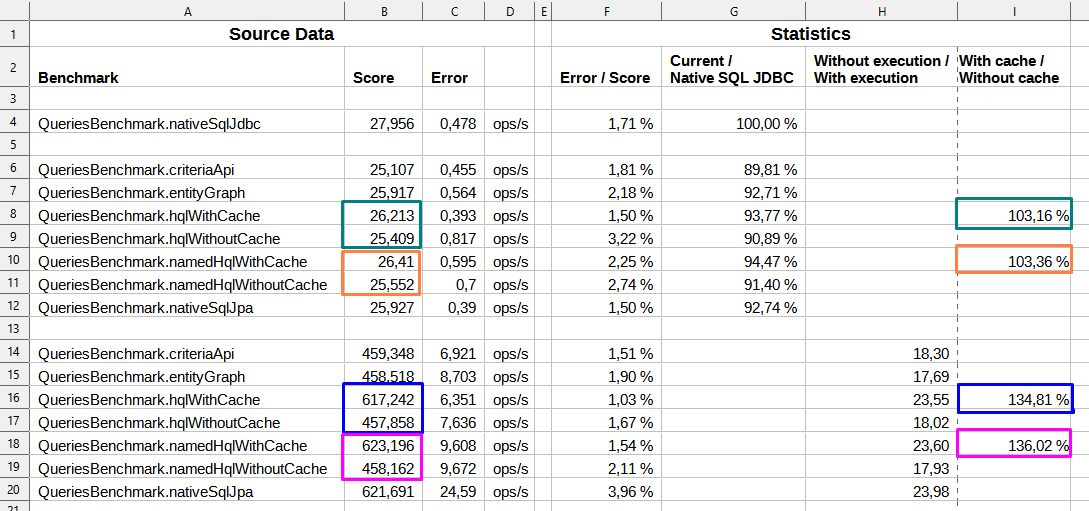
Table 5 — With and without query plan cache
Conclusions
- All JPA methods give a decrease speed of query processing by 7-10% compared to JDBC
- Compilation of query takes 18-24 times less time than its execution